Bode plot
Bode plot:
Bode Plot: Example 4
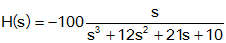
Draw the Bode Diagram for the transfer function:
Step 1: Rewrite the transfer function in proper form.
Make both the lowest order term in the numerator and denominator unity. The numerator is an order 1 polynomial, the denominator is order 3.

Step 2: Separate the transfer function into its constituent parts.
The transfer function has 4 components:
- A constant of -10
- A pole at s=-10
- A doubly repeated pole at s=-1
- A zero at the origin
Step 3: Draw the Bode diagram for each part.
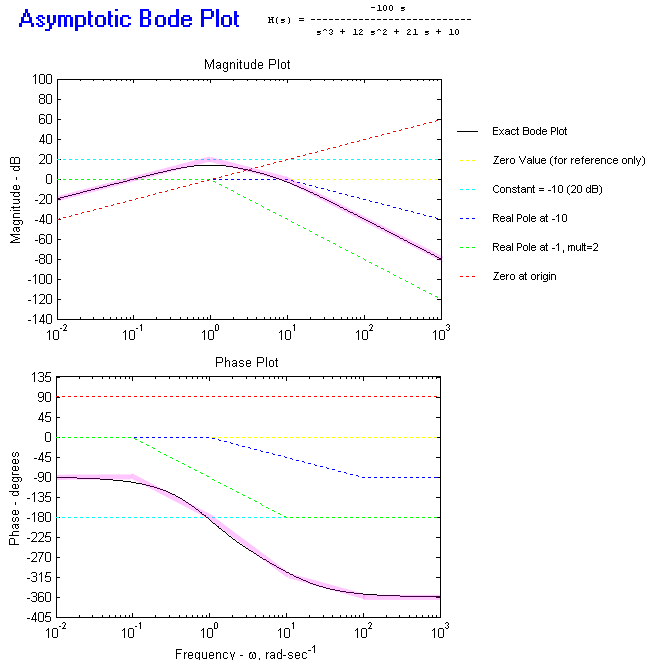
This is done in the diagram below.
- The constant is the cyan line (A quantity of 10 is equal to 20 dB). The phase is constant at -180 degrees (constant is negative).
- The pole at 10 rad/sec is the blue line. It is 0 dB up to the break frequency, then drops off with a slope of -20 dB/dec. The phase is 0 degrees up to 1/10 the break frequency then drops linearly down to -90 degrees at 10 times the break frequency.
- The repeated pole at 1 rad/sec is the green line. It is 0 dB up to the break frequency, then drops off with a slope of -40 dB/dec. The phase is 0 degrees up to 1/10 the break frequency then drops linearly down to -180 degrees at 10 times the break frequency. The magnitude and phase drop twice as steeply as those for a single pole.
- The zero at the origin is the red line. It has a slope of +20 dB/dec and goes through 0 dB at 1 rad/sec. The phase is 90 degrees.
Step 4: Draw the overall Bode diagram by adding up the results from step 3.
The overall asymptotic plot is the translucent pink line, the exact response is the black line.